 |
| PHOTOGRAPH: HULTON DEUTSCH/GETTY IMAGES |
Because you need another article on Novel Coronavirus and COVID-19.
This article is very enlightening just from a math perspective on the discrepancies in the accounts of number of cases and fatality rate regarding the 1918 outbreak of Spanish Flu.
It's a good read, but this post makes four days in a row of coronavirus related posts, so starting tomorrow, Monday, I am going to reverse that trend and go at least four days without any posts on this subject.
FROM: https://www.wired.com/story/covid-19-is-nothing-like-the-spanish-flu/
03.13.2020 09:00 AM
Covid-19 Is Nothing
Like the Spanish Flu
A
widely cited stat about death rates seems to argue otherwise, but it's surely
incorrect. So how'd it end up in the research literature?
Coverage of the novel coronavirus pandemic teems with monstrous and sometimes contradictory statistics. Among the most vexing figures flitting across our screens, and spreading via text and tweet, is the case fatality rate (CFR)—the proportion of known infections that result in death. Early in the Covid-19 pandemic, World Health Organization officials announced an average CFR of 2 percent. Later on, they revised it up to 3.4 percent. In contrast, numerous epidemiologists have argued that the global case fatality rate is closer to 1 percent. These might seem like small differences, but when multiplied across large populations they translate to significant discrepancies in overall deaths.
Some experts have emphasized the difficulty of calculating the fatality rate of an emerging pandemic, explaining that current estimates are biased by a deficit of testing and by the lag time between onset of illness and death. Despite this counsel, news coverage and social media discourse has obsessed over CFRs and how they compare across pandemics throughout history. A popular refrain is that the new coronavirus has a frighteningly high fatality rate of at least 2 percent, which is supposedly comparable to that of the 1918 influenza pandemic, also known as the Spanish flu—one of the deadliest viral outbreaks in history. The truth is that this comparison is severely flawed and that the numbers it relies on are almost certainly wrong.
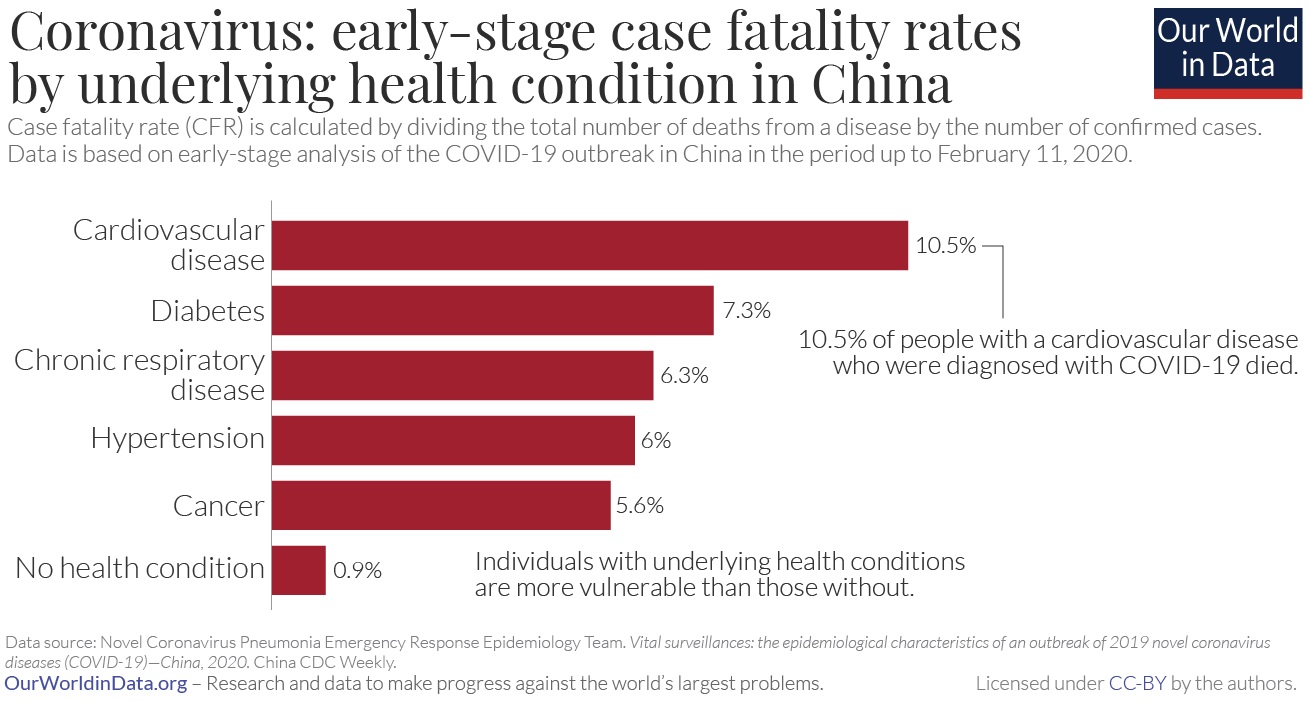
| https://ourworldindata.org/coronavirus |
Both newspapers and scientific journals frequently state three facts about the Spanish flu: It infected 500 million people (nearly one-third of the world population at the time); it killed between 50 and 100 million people; and it had a case fatality rate of 2.5 percent. This is not mathematically possible. Once a pandemic is over and all the numbers are tallied, its case fatality rate is simply the total number of deaths divided by the total number of recorded cases. Each country and city will have its own CFR, but it’s also common to calculate a global average. If the Spanish flu infected 500 million and killed 50 to 100 million, the global CFR was 10 to 20 percent. If the fatality rate was in fact 2.5 percent, and if 500 million were infected, then the death toll was 12.5 million. There were 1.8 billion people in 1918. To make 50 million deaths compatible with a 2.5 percent CFR would require at least two billion infections—more than the number of people that existed at the time.
Puzzled by this discrepancy, I started to investigate its possible origins. No one knows precisely how many people the Spanish flu infected and killed; estimates have generally increased over time and researchers still debate them. When describing the global toll of the 1918 pandemic, most people reference an influential 2006 study published in Emerging Infectious Diseases. The US Centers for Disease Control and Prevention, which publishes that journal, prominently displays the study on its website; and the article is one of the first Google search results for "Spanish flu fatality." In its opening paragraph, and with essentially no context, this study lists the three incongruent figures that have been so widely repeated: 500 million infections; 50 to 100 million deaths; 2.5 percent CFR. To be fair, the authors write that “case fatality rates” (plural) were “> 2.5%,” perhaps implying some variation from region to region. Because that figure is juxtaposed with worldwide infections and deaths, however, most people have interpreted it as a global average.
 |
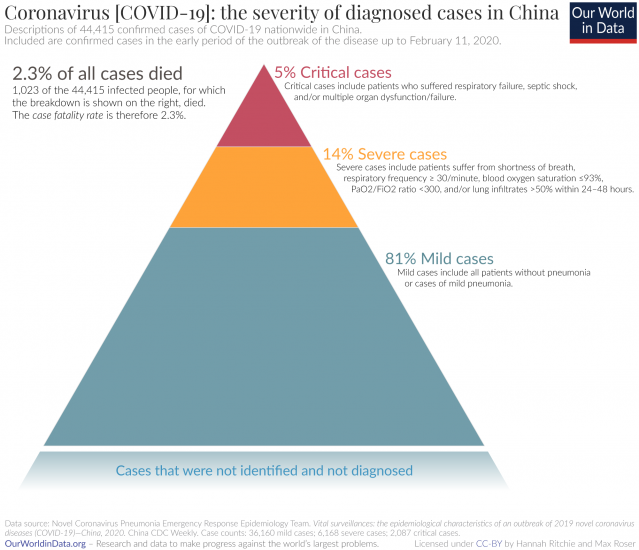
| https://www.latimes.com/science/story/2020-03-07/why-the-coronavirus-fatality-rate-keeps-changing |
It’s not clear how the authors settled on 2.5 percent. The two sources they cite for this figure do not offer much support. One of them, a 1980 edition of a public health compendium, indicates a global CFR of 4 percent for the Spanish flu, nearly twice as high. The other, a 1976 book coauthored by a medical writer and a medical librarian, suggests that the virus had an overall infection rate of 28 percent and killed more than 22 million, which works out to a global CFR of at least 4.3 percent. I reached out to the authors of the 2006 paper to clarify. One never responded. The other said, "the figures you refer to are not our figures but widely cited figures of other scientists” and that he didn't "have any opinion about how accurate they might be." He suggested I contact the different scientists who came up with those numbers.
Unfortunately, the two purported sources for the 2.5 percent fatality rate were published more than 40 years ago, and their authors are no longer with us. I was able to reach public health expert Niall Johnson, however, primary author of a 2002 study that produced the oft-quoted estimate of 50 to 100 million deaths during the 1918 pandemic. He confirmed that “the case fatality rate must be higher than is often given." Historian John Barry, who wrote the comprehensive 2004 book The Great Influenza, agreed that 2.5 percent is much too low. The CFR was possibly around 2 percent in the US and some other parts of the developed world, he said, but fatality rates were much higher elsewhere. Johns Hopkins University epidemiologist Jennifer Leigh recently told The Los Angeles Times that the overall fatality rate for Spanish flu may have been closer to 10 percent.
 |
| https://www.marketwatch.com/story/coronavirus-fatality-rates-vary-wildly-depending-on-age-gender-and-medical-history-some-patients-fare-much-worse-than-others-2020-02-26 |
We can calculate a range of plausible global fatality rates for the Spanish flu by varying the number of infections from 25 to 75 percent of the world population in 1918 and the number of deaths from 25 to 100 million. If we do so, we find that a reasonable estimate for the global case fatality rate of the Spanish flu is 6 to 8 percent. To be clear, this means that 6 to 8 percent of those who were infected died. Global mortality of the Spanish flu—which is to say, the proportion of all people everywhere (infected and uninfected alike) who died from the disease—was probably between 2 and 4 percent. A conflation of mortality across the world and fatality among the infected may partly explain some of the pervasive statistical confusion surrounding the Spanish flu.
Despite the mathematical impossibility of the Spanish flu killing at least 50 million with a 2.5 percent fatality rate, this phantom statistic has drifted far and wide, materializing everywhere from blogs, Twitter, and The New York Times to the most prestigious medical journals. The New England Journal of Medicine recently published some commentaries repeating the incongruent figures. I contacted the journal’s editors and statistical consultants, pointing out the mistake and explaining what I’d discovered about its possible origins. A few days later I got a reply from Jennifer Zeis, director of media and communications: "Authors relied on different sources of information, which would yield discrepant values. There are published sources for each number, even if they are inconsistent."
 |
| https://ourworldindata.org/coronavirus |
Of course estimates differ; the pandemic in question happened more than a century ago, and we don’t have anything close to complete or accurate records of its casualties. But that does not explain away a glaring mathematical incongruity, nor does it justify an abdication of scholarly responsibility. When errors slip past the safeguards of peer-reviewed research literature, they should be promptly corrected, especially when they have potential to breed misunderstanding and panic. Spanish flu has become synonymous with a viral apocalypse and, now, with the Covid-19 pandemic. This false equivalence depends largely on a spurious statistic that should never have been published. It is certainly possible, perhaps even inevitable, that a pandemic on the scale of the Spanish flu will happen again. But the latest estimates of Covid-19’s fatality rate, infectiousness, and its response to public health measures indicate that in relative terms it will not match the devastation of 1918. The Spanish flu’s global mortality rate of 3 percent would translate to more than more than 230 million deaths today.
There are many additional reasons not to make blithe comparisons between the current crisis and the 1918 pandemic: stark differences in health care infrastructure and medical technology; the ravages of the first world war; the unusual tendency of the Spanish flu to kill young adults; and the fact that many, if not most, people infected with influenza in 1918 died from secondary bacterial infections (as mass-produced antibiotics did not yet exist). The global fatality rate is just an average, and the CFR of any pandemic varies immensely by age, population, and geography. During the Spanish flu, for instance, it ranged from less than 1 percent in some areas to 90 percent in one Alaskan village. What gets lost in superficial analogies is that, despite some valid and instructive parallels between the two pandemics, there are many more differences. We can’t use half-contrived statistics about a century-old pandemic to predict what will happen today.
 |
| https://www.aljazeera.com/news/2020/02/cloneofcloneof200215224437270-200216231809757-200217231044837.html |
When WHO director-general Tedros Adhanom Ghebreyesus announced on March 3 that the novel coronavirus had a global case fatality rate of 3.4 percent, he was simply reporting known deaths divided by known cases, not an intelligent estimate or a definitive number. Infectious disease mathematician Adam Kucharski and his colleagues recently calculated that the true case fatality rate in China is between 0.3 and 2.4 percent; other researchers have concluded that the global CFR is likely similar. These estimates will continue to change with time and increased testing. Some experts anticipate that, if widespread testing were deployed, the global fatality rate would remain at or below 2 percent. There’s also a possibility, however, that the final global fatality rate will be higher than current data indicate. Near the start of the 2009 H1N1 pandemic, CFR estimates were 10 times too large. During the 2002-04 SARS outbreak, however, early CFR estimates were nearly three times too small.
The novel coronavirus pandemic is a major threat that demands a swift and robust response. Even a fatality rate between 0.5 and 1 percent is extremely alarming in a world as populous and interconnected as ours. Another crucial consideration is the virus’s potential to induce severe illness that may not be fatal but lasts for weeks, straining hospital resources and potentially leaving some people with lifelong health issues. If the multiplying outbreaks around the world are not curtailed, we could see staggering numbers of illnesses and deaths, especially among the elderly and those with underlying medical conditions. Recently, some infectious disease experts have suggested that Covid-19 could reach the scale of the 1957 avian influenza pandemic, which killed an estimated 1 million to 4 million people worldwide. But that is only one possible trajectory. The outcome of the current pandemic will not be shaped by any single statistic, but by a constellation of social, economic, and environmental factors—including the vulnerability of infected populations, the speed and scale of public health interventions, and the transparency of governments.
Numbers and charts convey a reassuring sense of certainty. But in the midst of an evolving crisis, that certainty is too often an illusion. A single, imprecise statistic generated more than a decade ago can suddenly proliferate, inciting panic and senseless hoarding that diverts resources from those who need them most. When experts and journalists uncritically pluck numbers from careless studies and clutch at fluctuating figures, hastily offering them up as beacons, they may do more to confuse than illuminate.
+++++++++++++++++++++++++++++++++++++++++++++++++++++++++++++++++++++++
+++++++++++++++++++++++++++++++++++++++++++++++++++++++++++++++++++++++
+++++++++++++++++++++++++++++++++++++++++++++++++++++++++++++++++++++++
- Bloggery committed by chris tower - 2003.15 - 10:10
- Days ago = 1716 days ago
- New note - On 1807.06, I ceased daily transmission of my Hey Mom feature after three years of daily conversations. I plan to continue Hey Mom posts at least twice per week but will continue to post the days since ("Days Ago") count on my blog each day. The blog entry numbering in the title has changed to reflect total Sense of Doubt posts since I began the blog on 0705.04, which include Hey Mom posts, Daily Bowie posts, and Sense of Doubt posts. Hey Mom posts will still be numbered sequentially. New Hey Mom posts will use the same format as all the other Hey Mom posts; all other posts will feature this format seen here.

No comments:
Post a Comment